Methodology
1- Full Scale measurements
The slipstream calculations will be measured through full-scale measurements. The full-scale test campaign will be partially carried out at Uffington on the Western Main Line (see Figure 3) and the main series of tests on HS1 will take place in the spring of 2015 in conjunction with another EPSRC project EP/K037676/1 (gow.epsrc.ac.uk/NGBOViewGrant.aspx?GrantRef=EP/K037676/1). However, a preliminary series of tests were carried out in the summer of 2012. At this point there is a double track, 200kph railway which is used by around 6Class 43 trains an hour, in either two power car plus seven coach formation(2+7), or two power car plus eight coach formation (2+8). These tests consisted of slipstream measurements, pressure transient measurements and under-body measurements.
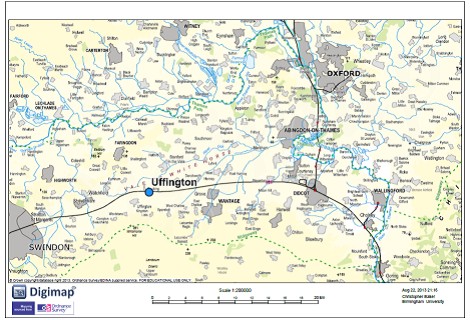
Figure 3 Primarily full-scale test location at Uffington
In addition to the slipstream measurements, two sets of measurements have been also carried out on the Network Rail "New Measurement Train" (NMT), aClass 43 train that is used to measure track geometry and condition in the UK(Figure 4). The first measured the pressure around the train nose, which, together with the output from a nose pitot tube, enables the instantaneous yaw angle of the flow to be obtained. The second set of measurements was made on a loop around the rear power car of the train (Figure 4).
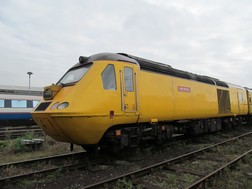
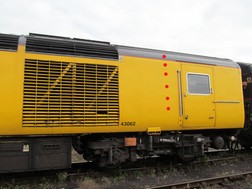
Figure 4 HST train showing a loop of pressure taping at the rear of the leading car.
A sample result of these measurements is shown in Figure 5.
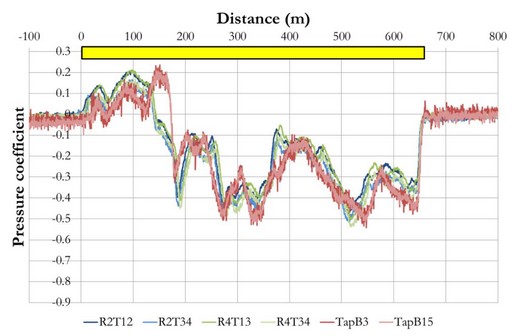
Figure 5 Comparison of pressure transients on train walls through Ampthill tunnel between the NMT and a Class 222.
2- TRAIN Rig measurements
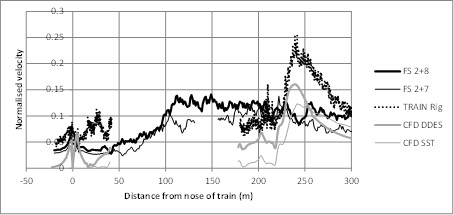
A number of different types of test are being carried out on the TRAIN rig(shown below) using a 1/25th 4 car (2+2 consist) scale model of the Class 43(figure 6). The first set of tests aimed to replicate the full scale measurement positions on the Great Western Mainline. The train speeds were around 40 m/s to meet CEN compliance of a minimum Re number of 250 000. Experiments were also carried out at the same height as in the full scale measurements (0.7m above the rail), and ensemble averages of the measured pressures and velocities were formed from around 20 runs of the rig. The second set of tests aimed to quantify the effect of ballast shoulder height on the slipstream velocity at (and near to) the TSI position of 2 m from track centreline and 0.2 m above TOR. Three ground configurations were selected -flat ground, a typical UK height ballast shoulder (0.3m) and a TSI compliant ballast shoulder representative of European conditions (0.7m).

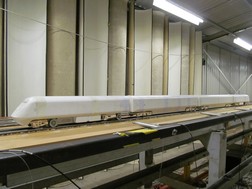
Figure 6 Moving rig model.
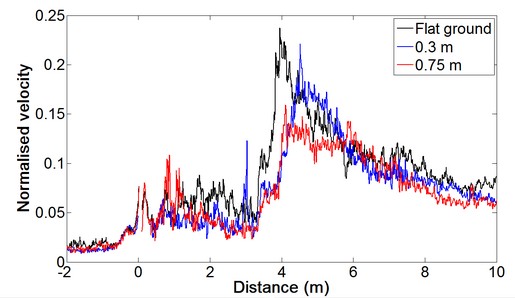
Figure 7 Physical modelling data (slipstream velocity) from the moving rig.
3- CFD calculations
RANS and DES CFD simulations of the flow around the 1/25th scale four car Class 43 have been carried out using an OpenFOAM generated mesh with a total of 44.1 million cells. Air speed was set at 40 m/s, which results in a Reynolds number of around 300,000 based on the train height. The RANS approach uses the k-? SST turbulence model, The DES approach uses the Spalart-Allmarasturbulence model for the RANS regions. Both RANS and DES calculations give large amount of detailed results that have been used to reveal the flow around the model scale high-speed train. Also, results from the DES approach are time averaged to enable comparison to the RANS and TRAIN rig results. Figure 8 shows a visualisation of the slipstream, using both iso-surface of the second invariant of the velocity gradient and a plane coloured by velocity magnitude. A sample of the comparison between the different methodologies is shown in Figure 9.
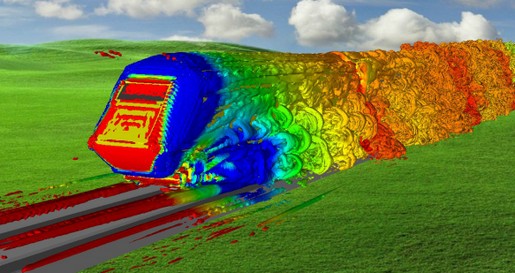

Figure 8 Visualisation of the CFD slipstream flow structure.