Edgbaston
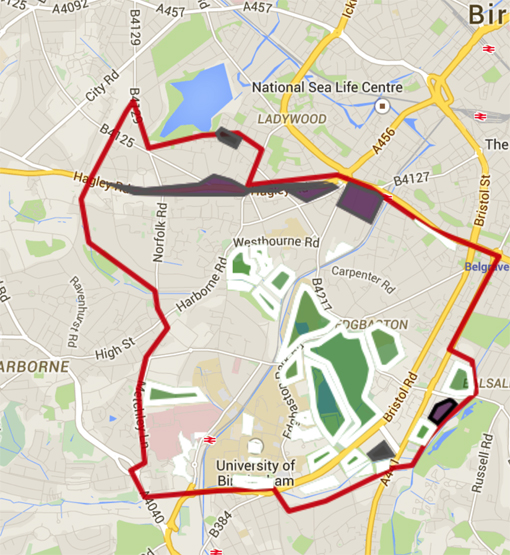
The Edgbaston neighbourhood (encapsulating the Edgbaston ward) is situated to the south west of Birmingham city centre. It is a more recently diversifying neighbourhood where new migrants outnumber old. The area is less densely populated than other areas of the city. The ward contains some of the most desirable housing in the City and characterised by areas of ‘wealthy achievers’ (wealthy executives and families and affluent older people) and ‘urban prosperity’ (prosperous professionals, educated urbanites; aspiring singles). However, there are also some areas of deprivation, with pockets of ‘hard pressed households’ (struggling families, singles and older people; ACORN classification). Housing particularly comprises of flats (48.2% of housing stock and reflecting the high numbers of students and hospital staff in the area, compared to an average of 20.4% for Birmingham and 16.7% for England) and detached houses (19.2% of housing stock compared to 10.9% for Birmingham; Birmingham City Council, 2012a).
In 2011, 24,426 people lived in the area, and with males (50.5%) slightly outnumbering females (49.5%). It has a younger profile than the city average, although this is distorted by large numbers of students living in the area. 76% of the population are aged between 16 and 64 (Birmingham City Council, 2013a).
The most recent Indices of Deprivation (ID 2010) highlight that it is one of the least deprived neighbourhoods in Birmingham (34 out of 40). 12% of residents live in the 10% most deprived areas of England. 23% of children are defined as living in poverty, compared to a figure of 34% for Birmingham (2011 figures; Birmingham City Council, 2012b). Average household income in 2009 was £37,000 per annum, compared to a city average of £31,000 (Birmingham City Council, 2012b). 60% of the population are economically active, compared to a city average of 69% and again particularly reflecting the student population in the area. Indeed, 29% of the economically inactive (5,412) are students, much higher than the city average of 11% (Birmingham City Council, 2012a). However, in overall terms unemployment and worklessness are below the city average. For example, the worklessness rate (those of working age not employed including those seeking work / not seeking work) in 2013 was 10.1%, compared to a citywide average of 16.7% (Birmingham City Council, 2013b).
In terms of key sectors of employment, the largest employers overall are the University of Birmingham (6302 employees in total), the National Express Bus Group Plc (1,404 employees) and the Birmingham Women’s Health Care NHS Trust / Queen Elizabeth Hospital (2,200 employees together (Birmingham City Council, 2012b).
With regards to education and skills, the resident population – on average – is highly educated and well skilled. A significant proportion of residents (34.5%) are employed in higher and intermediate occupations (ONS, 2011), and Professional occupations make up the largest sector in terms of the occupations of working residents by some considerable distance (33% compared to average of 17% for England and Wales). Nearly 70% of residents (12,845 individuals) have a Level 3 or Level 4 qualification or above (Birmingham City Council, 2012a).
With reference to super-diversity and health, it is possible to highlight various features of the population that are of relevance. In terms of ethnicity, the proportion of ethnic minority residents is similar to the city average – 42%. The White ethnic group constitutes 59% of the total population. The next largest ethnic minority group is Asian (25%), followed by the Black population (8%) and then Mixed (4%) and Other ethnic groups (3%) respectively. The Indian population is particularly evident constituting 12% of the total ward population (ONS, 2011).
Key languages spoken (in rank order) include English, followed by Chinese, Urdu, Persian, Polish and Panjabi. In 11% of households (991 households), no individuals over the age of 16 have English as a main language (ONS, 2011). Just over 40% of the population are Christian (41.8%), followed by 26.1% stating ‘No religion’ and 11.2% stating Muslim. 5.7% stated Hindu and 4.7% stated Sikh (ONS, 2011).
29.3% of the population were born overseas. Edgbaston is unusual in that ‘new’ migrants outnumber ‘established’ migrants. Only three other wards in Birmingham have a similar pattern (Birmingham City Council, 2013a). Of those residents not born in UK, 44% have arrived in the last ten years (3,169 of 7,149). The majority are from outside of the EU, although there is a sizeable minority of residents from EU accession countries (646 residents; 2011) (Birmingham City Council, 2013a). Of those not born in the UK, the majority arrived between the ages of 20-24 and 25-29, followed by 30-34 (Birmingham City Council, 2013a).
In overall terms, the health of residents in Edgbaston is better than the average for England. In particular, Smoking Prevalence (11.2% compared to 20% for England), Cancer deaths preventable (34.2%; England 61.9%), Communicable disease deaths preventable (4.2%; England 29.9%) and Diabetes Prevalence (3.3%; England 5.8%) are lower than average. However, there are some anomalies – for example, Alcohol attributable admissions, Mental Health Prevalence (0.9%; England 0.8%) and Homelessness Acceptances (5.6%; England 2.3%) are all higher than average (Birmingham City Council, 2013d).
2011 Census data suggests that the proportion of residents in Very Good Health (52.8%) is higher than for Birmingham (45.5%) and England (47.2%). 13.1% of residents had a limiting long-term illness. This is lower than the average for Birmingham (18.4%) and England (17.6%) (ONS, 2011).
References
Birmingham City Council (2012a) Edgbaston Ward – Economic Key Facts. Birmingham: Birmingham City Council.
Birmingham City Council (2012b) Edgbaston Constituency: Economic and Employment Profile. Birmingham: Birmingham City Council.
Birmingham City Council (2013a) Population and Migration Topic Report. Birmingham: Birmingham City Council.
Birmingham City Council (2013b) Census 2011 – What does this mean for Birmingham? Birmingham: Birmingham City Council.
Birmingham City Council (2013c) Worklessness briefing. Birmingham: Birmingham City Council. Now b
Birmingham City Council (2013d) Edgbaston Ward: Health Profile 2013. Birmingham: Birmingham City Council.
Office for National Statistics (ONS) (2011) 2011 Census.