Jenny Crawley, Stephanie Ogunrin, Shivani Taneja, Inna Vorushlyo, Xinfang Wang
Background
The latest projections from the Met Office show that the UK annual average temperature is set to increase by 0.7-3 degrees from the 1981-2000 to the 2041-60 period (Met Office, 2019). Alongside average increases, summer temperatures will rise, as well as the frequency of heatwaves. The Met Office estimate that the extreme hot summer experienced in 2018 would be less than 0.5% likely with no manmade climate change, is 12% probable currently, and will be 50% likely by 2050 (Met Office, 2018). This raises the question of the likely uptake of domestic air conditioning.
Previous cooling scenarios and assumptions
Little data exists for the UK quantifying the relationship between AC uptake and its predictors. National Grid (2019) assumed a 60% penetration by 2050 (based on all homes in urban areas installing air conditioning). The Tyndall Centre (2016) constructed projections for 2030 using various scenarios. One was based on the current growth of the market (1.6% by 2030), one was based on growth as seen in other countries (2.9% by 2030), and two were based on simple DECC scenarios (33% and 67% by 2051). Finally, Peacock et al (2010) used the relationship between uptake and cooling degree days observed in America to predict 18% uptake in London by 2030, caveating this finding due to behavioural differences between the U.S. and England.
Aims of this project
- To construct a set of socio-technical scenarios for 2050 AC penetration
- To provide a first estimate of grid impacts based on temporal characteristics of air conditioning use
- To identify the data gaps and areas for future collaboration
Scenario construction
The aim was to produce a small number of scenarios using a limited set of social and technical variables which are known from the literature to be important predictors of air conditioning uptake. In an ideal world, an uptake model from now to 2050 would have been constructed however the data for this were not available, hence using a scenario approach. We focus on England to narrow the scope.
Building simulation was carried out using UCL’s HPRU model to explore some physical variables: geographical location, building age and dwelling type. Literature and other theory was used to examine the effect of other variables: heat stress, children, income, tenure, urban heat island.
Four scenarios
Four narratives were constructed as follows:
- Building-based scenario: homes built between 1990 and 2025 overheat more than others and all occupants install air conditioning. After 2025, the Future Homes standard for new buildings kicks in and overheating is significantly mitigated.
- Age demographic (1): all households where the Household Reference Person is aged 75 or over install get air conditioning. This takes place across the socio-economic and tenure spectrum, perhaps as a result of a policy equivalent to the Winter Fuel Discount which only considers age.
-
Age demographic (2): all owner-occupied dwellings with at least one dependent child install air conditioning.
- Wealth demographic scenario: all owner-occupied dwellings with income above the median install air conditioning.
Since climate is known to be an important factor (Yun & Steemers, 2011), each of the above four scenarios had two implementations: one for all dwellings in the category, and one confined to urban environments in the south of England. ‘Urban’ was defined as the three ‘predominantly urban’ categories of conurbation defined by DEFRA (2011).
Summary of scenario results
- The range of air conditioning penetration from the above scenarios was 5-32% of English households
- This is obviously a very simplistic treatment of uptake which uses crude and simple categories and some combinations of categories. In reality, within a given category, not ‘all’ the population of that category would adopt air conditioning.
- All of the scenarios resulted in less than a third of households adopting AC. This is much lower than National Grid’s prediction of 60%.
- They have been constructed so that the location/weather variable (the south/urban flag) makes a big difference (5-12% of households if the flag is applied, 19-32% if it is not). The size of this difference in reality is currently unknown in England.
Building Modelling
In order to estimate the grid impacts of the above scenarios, the half hourly AC power consumption on a hot day was estimated for two of the most common building types in the UK. Therefore, a one-storey semi-detached house and a three-storey block of flats was modelled using Autodesk Revit. Both dwelling types were modelled using standard current standard construction.
Method
It was intended to carry out building simulation using 2050 climate projections, however the free Prometheus files available displayed erroneously cooler weather than currently so were regarded as not compatible with latest Met Office predictions (Met Office, 2019b). Therefore, current weather files for London Heathrow were generated using Meteonorm data. Designbuilder software was then used to carry out half hourly dynamic thermal simulations of the 2 buildings using the weather files.
Key features of the building modelling are summarised here:
- Timings of air conditioning use were based on the best available data: the UK-based empirical study by Pathan et al (2008) and some additional building simulation showing the time of the warmest internal temperatures to be 2-6pm
- Windows were assumed to be closed at night, in accordance with Mavrogianni et al (2017) who showed that this was the case in a proportion of London homes for reasons of noise and security
- Internal temperature above which AC was switched on was also based on Pathan et al (2008) as 25°C for living rooms during the day/evening and 20°C for bedrooms at night.
Electricity System Modelling
Method
- The AC loads derived in the previous section were simply multiplied by the uptake scenarios above to give a total AC load. A COP of 3 was used to convert kW(th) to kW(elec)
- National Grid’s ‘Two Degrees’ scenario (National Grid, 2019) was used to predict the other demands on the grid, as well as the solar and typical wind power. The other grid demands included significant EV charging.
- AC load was then added to the other grid demands to investigate the potential effect of air conditioning.
Results
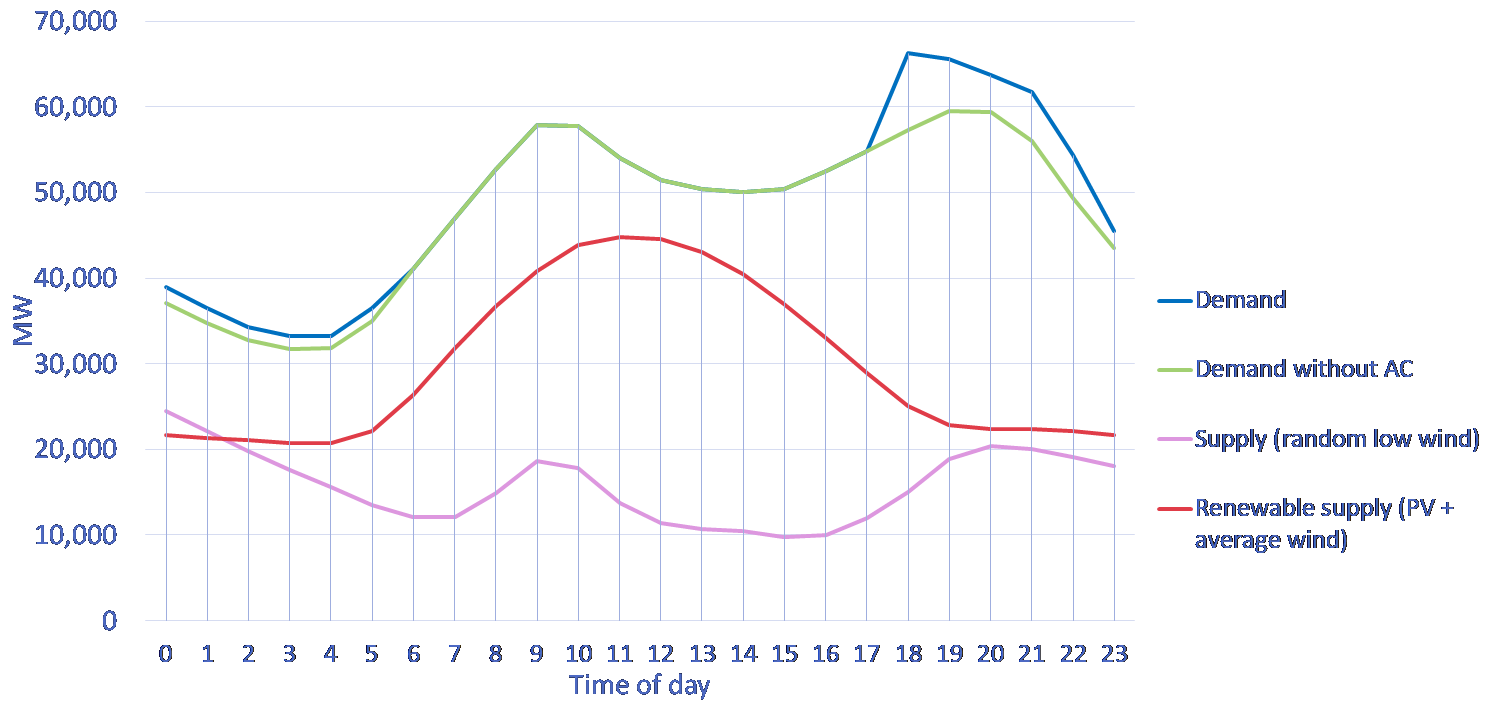
Our highest (i.e. worst case) scenario increases the evening peak by 7 GW. In this scenario the reason for the peak increase is the pre-existence of an evening EV charging peak coincidental with AC demand. AC is not coincidental with solar PV generation.
This is based on scenario modelling and not absolute truth, therefore the best interpretation of the results is perhaps to explore the issues and questions it raises:
- If EV charging and AC are coincidental, does this present a problem for the electricity system? If so, which demand should take priority and which should be shifted?
- How can renewable generation be reconciled with AC demand which occurs hours later?
- What is the effect of AC demand diversity on the results?
Project Summary
- Domestic cooling is an energy demand meriting more investigation
- If air conditioning is used as we assume in our scenarios, summer peak will increase and demand will not coincide with optimum renewable generation
- Key gaps in the evidence base were found to include:
What motivates English households to install air conditioning? What time of day or night is air conditioning really used? How many rooms will air conditioning be installed in per home? How coincident is the AC demand across UK households?
References
- DEFRA. (2011). 2011 Rural-Urban Classification of Local Authority Districts and Similar Geographic Units in England: A User Guide London: HMG.
- Mavrogianni, A., Pathan, A., Oikonomou, E., Biddulph, P., Symonds, P., & Davies, M. (2017). Inhabitant actions and summer overheating risk in London dwellings. Building Research & Information, 45(1-2), 119-142.
- Met Office. (2018). Chance of summer heatwaves now thirty times more likely. Retrieved from https://www.metoffice.gov.uk/about-us/press-office/news/weather-and-climate/2018/2018-uk-summer-heatwave
- Met Office. (2019). UKCP18 Science Overview Report. Retrieved from https://www.metoffice.gov.uk/pub/data/weather/uk/ukcp18/science-reports/UKCP18-Overview-report.pdf
- National Grid. (2019). Future Energy Scenarios.
- Pathan, A., Young, A., & Oreszczyn, T. (2008). UK Domestic Air Conditioning: A study of occupant use and energy efficiency.
- Peacock, A. D., Jenkins, D. P., & Kane, D. (2010). Investigating the potential of overheating in UK dwellings as a consequence of extant climate change. Energy Policy, 38(7), 3277-3288. doi:https://doi.org/10.1016/j.enpol.2010.01.021
- Tyndall Centre. (2016). Air Conditioning Demand Assessment. Retrieved from https://www.enwl.co.uk/globalassets/innovation/enwl001-demand-scenarios--atlas/enwl001-closedown-report/appendix-3---tyndall-uom---air-conditioning-demand-report-may2016.pdf
- Yun, G. Y., & Steemers, K. (2011). Behavioural, physical and socio-economic factors in household cooling energy consumption. Applied Energy, 88(6), 2191-2200. doi:https://doi.org/10.1016/j.apenergy.2011.01.010